Active
Mapping the climate potential of insetting
CLIMATE
Active
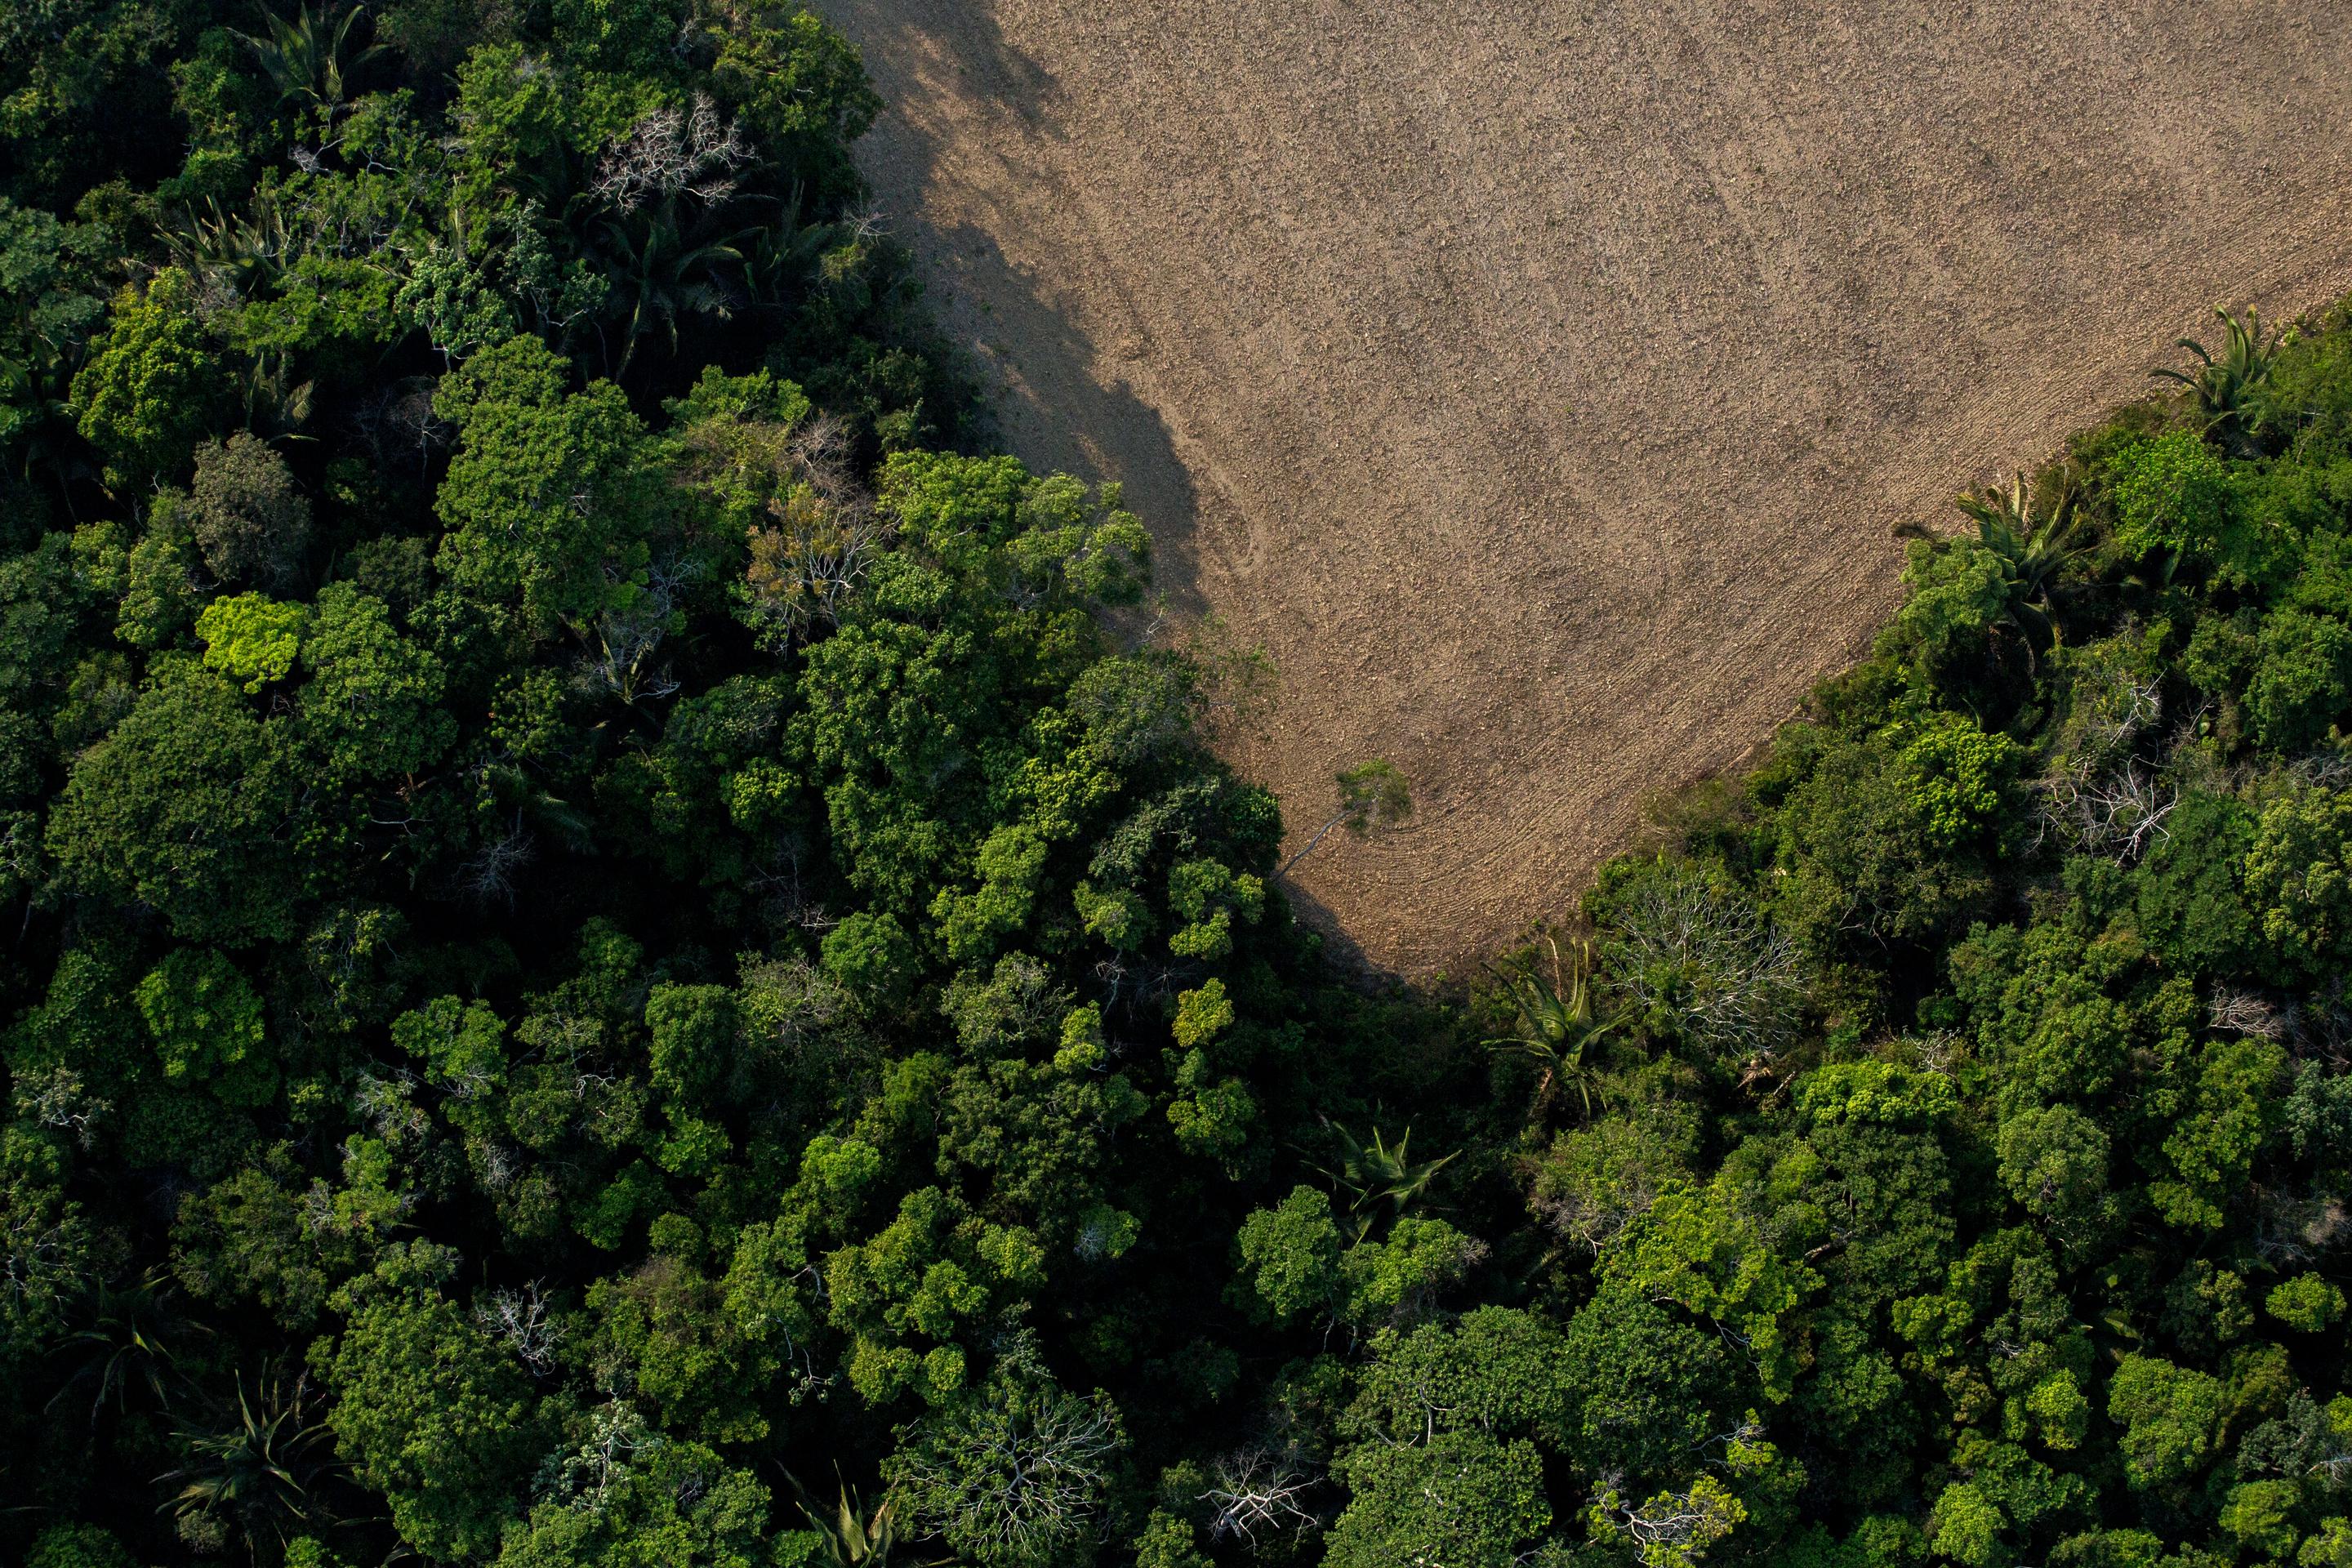
Conservation International has mapped where nature-based solutions — like tree planting, improved grazing practices and regenerative agriculture — can most effectively reduce emissions from farming.
These insights help companies focus their efforts on the places and supply chains where they’ll make the greatest difference.
Agriculture supplies the food and fiber we rely on and supports the livelihoods of approximately 32 percent of the world’s population. However, crop and grazing lands account for nearly 50 percent of all land use, while contributing about 20 percent of global emissions. This means that improvements to the way we farm could significantly reduce and remove greenhouse gas emissions.
While over 1,000 agricultural companies have set climate goals, many overlook nature-based solutions in their plans.
Here’s how we can change that:
Natural climate solutions in agricultural systems have the potential provide 4 GtCO2e per year in climate mitigation, and roughly a third of this is likely accessible today via insetting.
These solutions can cut global agricultural emissions by more than two-thirds. Brazil, India, China and the United States are among the countries with the most climate mitigation potential.
Just seven of the 20 supply chains assessed account for 95 percent of the total mitigation potential.
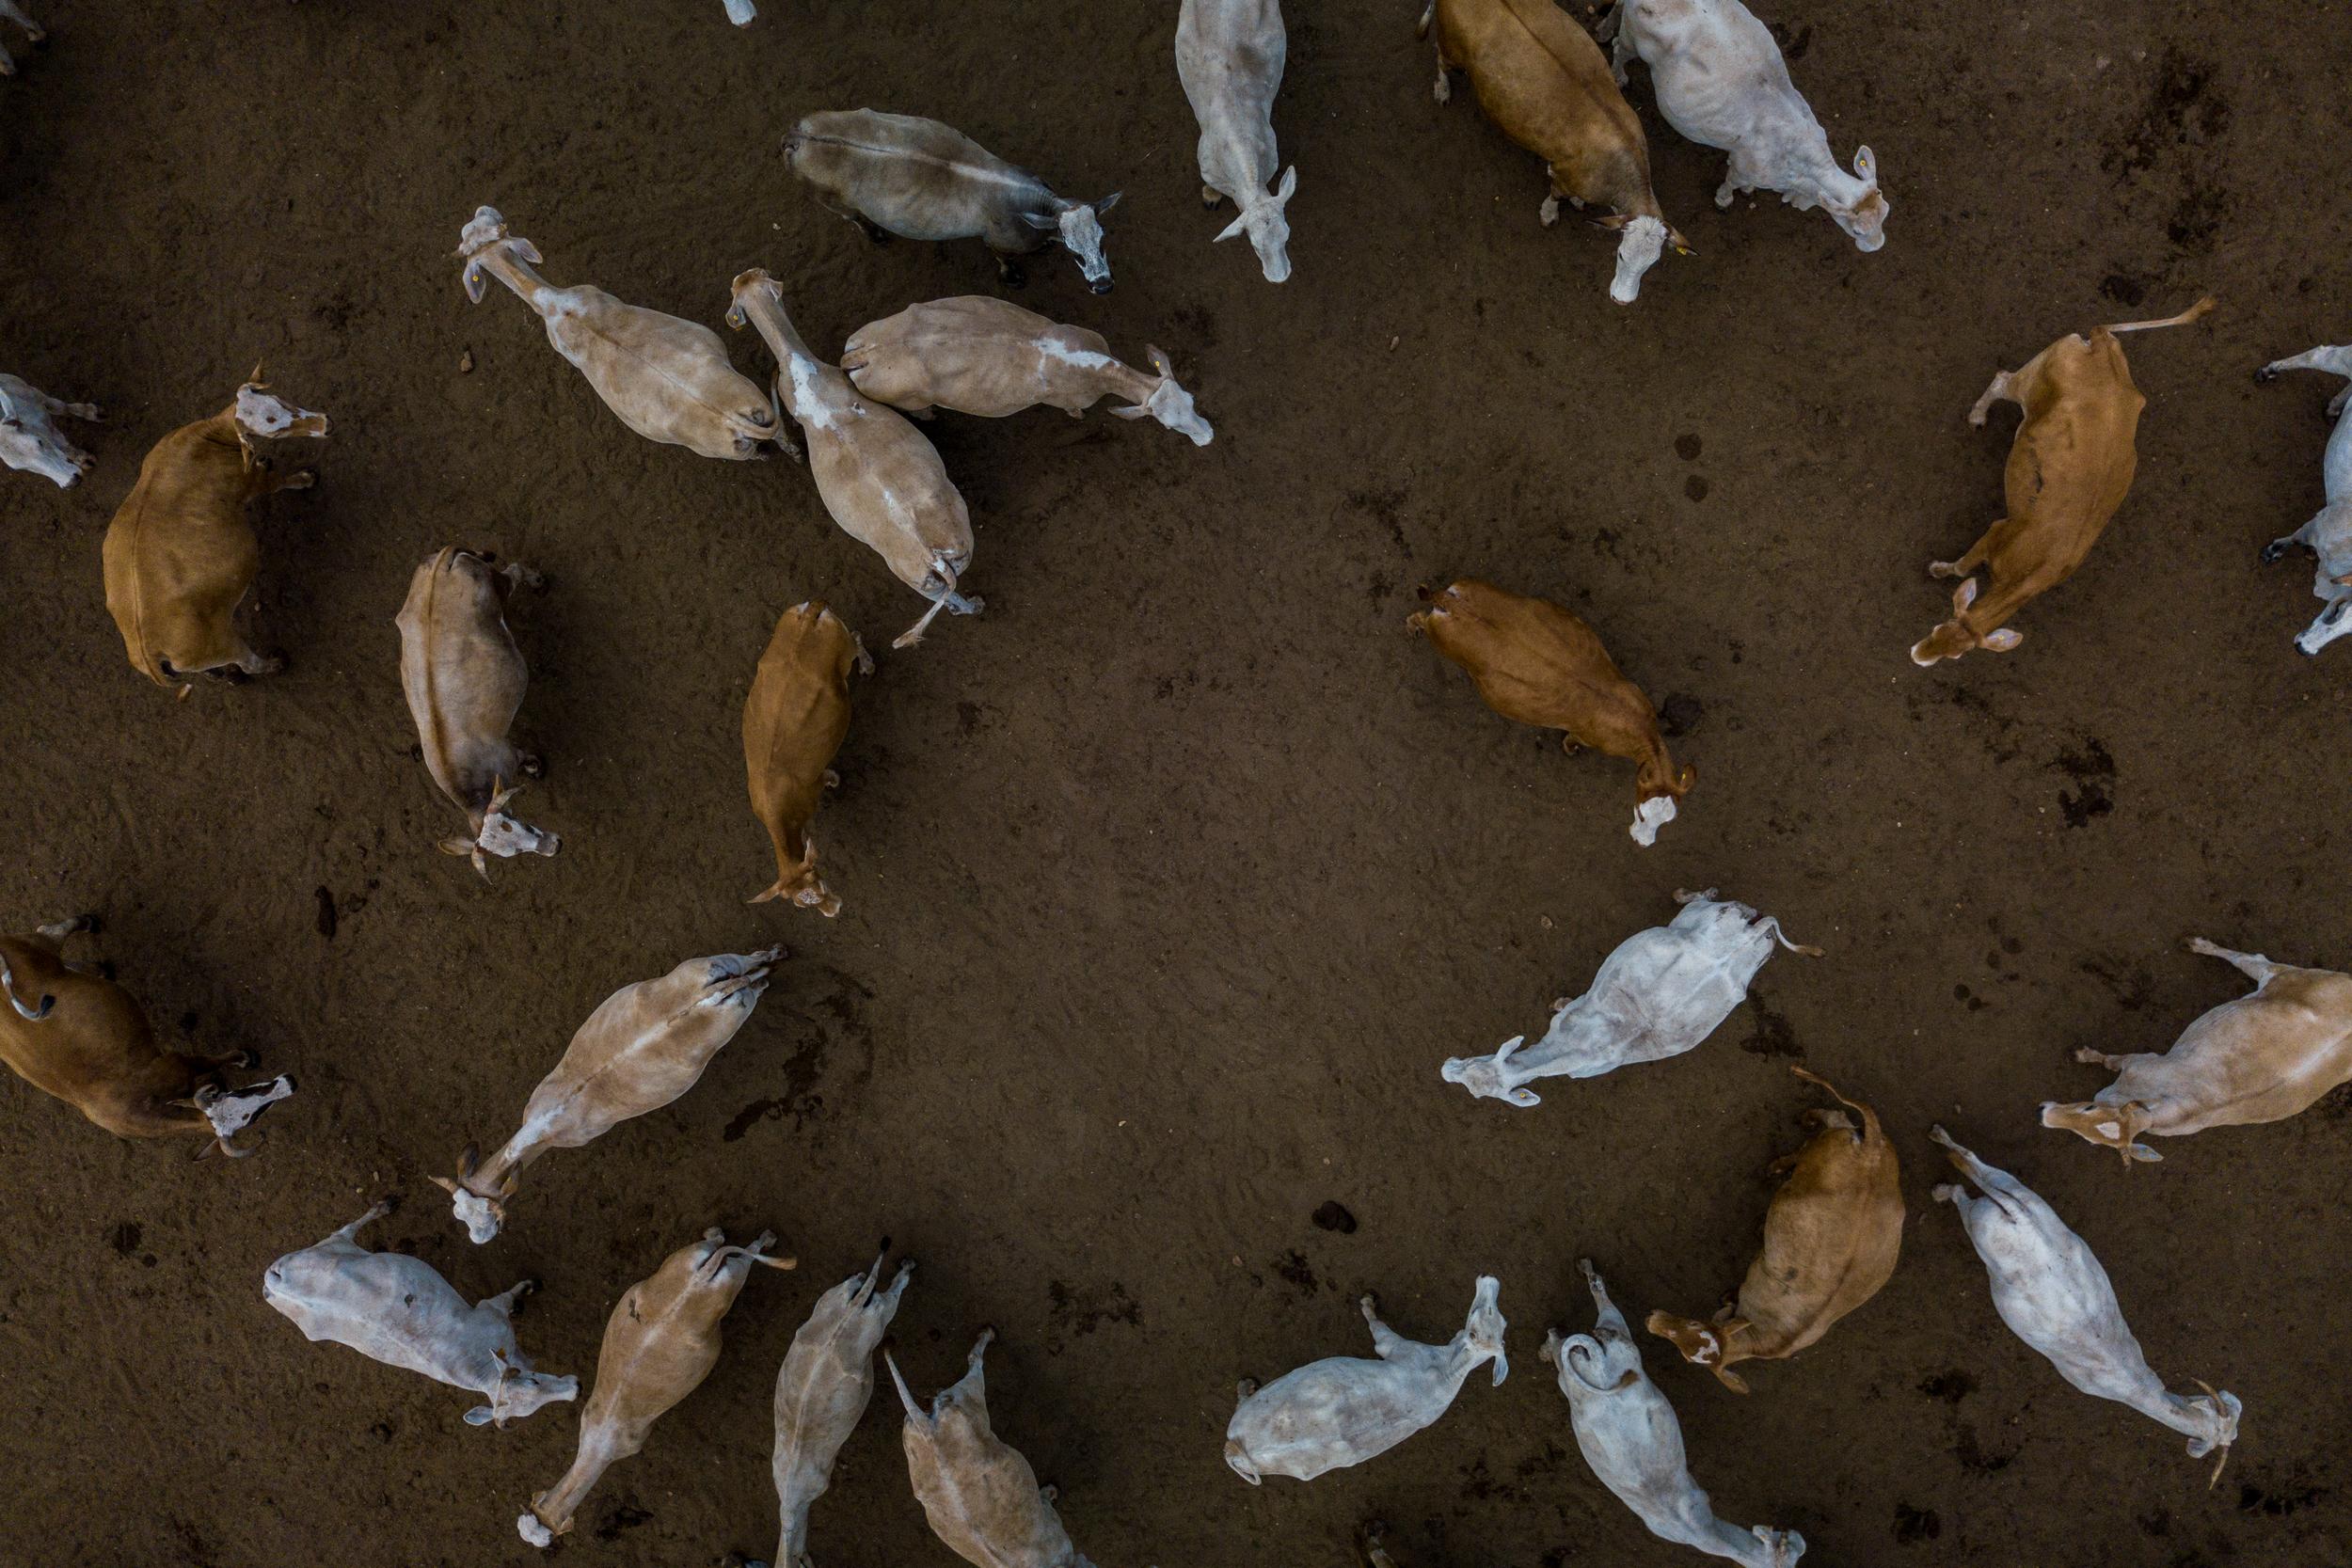
The cultivation of livestock, maize, soy, rice and wheat cultivation offer the greatest potential for climate mitigation. Increasing soil carbon and integrating trees into grazing systems are among the most impactful areas for reducing emissions.
About 20 percent of the potential for climate mitigation is found on lands managed by Indigenous Peoples and local communities.
This underscores the importance of inclusive and equitable approaches.
This dashboard maps the global potential for nine types of Natural Climate Solutions across 20 commodity supply chains. The dashboard filters by commodity and geography.
Insetting helps firms manage supply chain risks while improving the resilience of ecosystems and communities they rely on. This mapping effort offers companies a roadmap for prioritizing climate-smart interventions and delivering measurable results.
Our high-integrity approach can help strengthen supply chain resilience, reduce long-term risk, and build trust with customers and investors.
We invite companies, investors and standards developers to use this data to inform strategy and target investment. For more information or to explore partnerships, please contact us at insetting@conservation.org.
Becker, D., & Donatti, C. (2024, September 18). Climate Adaptation NbS. https://doi.org/10.17605/OSF.IO/3RPFD
Chaplin-Kramer, R., Neugarten, R.A., Sharp, R.P. et al. Mapping the planet’s critical natural assets. Nat Ecol Evol 7, 51–61 (2023). https://doi.org/10.1038/s41559-022-01934-5
Economist Intelligence Unit (2006-2023) – processed by Our World in Data. “Democracy index” [dataset]. Retrieved from https://ourworldindata.org/grapher/democracy-index-eiu
Institute for Global Environmental Strategies (IGES) (2022), Nationally Determined Contributions (NDC) Database, version 7.7. Retrieved from: https://pub.iges.or.jp/pub/iges-ndc-database
Garnett, S.T., Burgess, N.D., Fa, J.E., Fernández-Llamazares, Á., Molnár, Z., Robinson, C.J., Watson, J.E., Zander, K.K., Austin, B., Brondizio, E.S. and Collier, N.F., 2018. A spatial overview of the global importance of Indigenous lands for conservation. Nature Sustainability 1, 369-174
Naturebase (2024, June 6). Increased Soil Carbon in Croplands v2. Retrieved from https://naturebase.org
Naturebase (2024, June 6). Reduced Emissions in Croplands: Rice Cultivation v1. Retrieved from https://naturebase.org
Naturebase (2024, June 6). Reduced Emissions in Grazing Lands: Feed Management Additives v2. Retrieved from https://naturebase.org
Naturebase (2024, June 6). Savanna Fire Management v2. Retrieved from https://naturebase.org
OECD (2024) Policy Instruments for the Environment Database. Retrieved from https://www.oecd.org/en/data/datasets/policy-instruments-for-the-environment-pine-database.html
Sprenkle-Hyppolite, S., Griscom, B., Griffey, V., Munshi, E., & Chapman, M. (2024). Maximizing tree carbon in croplands and grazing lands while sustaining yields. Carbon Balance and Management, 19(1), 23.
Tang F., Nguyen T., Conchedda G., Casse L., Tubiello F., and Maggi F. (2023). CROPGRIDS, a global geo-referenced dataset of 173 crops, Scientific Data.
TCFD (2023). 2023 Status Report, Table D1, p.92. World Bank (2023) World Development Indicators: Structure of value added. Retrieved from: https://wdi.worldbank.org/table/4.2#
This is a global study that relies on global datasets. These datasets tend to make multiple assumptions and have large uncertainty. We recommend using these results for geographical prioritization and comparison. More detailed analyses that use datasets developed for each geography should be used for more accurate mitigation potential estimates for specific regions.
We focused on NCS strategies that could be attributed to cultivated or managed grasslands, without compromising socio-economic conditions. Restoration, reforestation, and avoided deforestation are examples of NCS strategies excluded.
Recent studies have demonstrated that previous estimates of the mitigation potential from increased soil carbon could be inflated by about 31-90% in the US. Due to a lack of global data we used an average value of 61% to discount the mitigation potential.
Naturebase NCS pathways aggregate multiple strategies, which limits the possibility of getting estimates for each strategy.
Rotational or temporary crops are difficult to map globally. CROPGRIDS data overestimated the area of these crops by 13%, on average. We used this value to discount the estimated mitigation potential from rotational or temporary crops.
Maximum tree cover for mitigation potential from trees in woody crops was based on tabular data instead of spatially explicit values due to a lack of global spatially explicit data.
Livestock mitigation potential is estimated from grazing land area. This area represents all managed grasslands with no distinction between degraded and well-managed pastures.
Technical mitigation potential for different livestock was estimated by estimating the proportion of grazing land mitigation potential to be allocated to each type of livestock.
Given that there is no spatially explicit dataset to determine cattle-derived commodities production, our analyses only refer to mitigation potential from livestock grazing.