Where man-made fires in this vital ecosystem are detected and why that matters
1,516,889
fire detections* in the Amazon in 2024
837,565
fewer fire detections* in 2024 compared to 2023
* Thermal anomalies detected by NASA VIIRS sensors with greater than or equal to 30% confidence in the most recent 48 hours (red) and 7 days (yellow). Click here for land governance data sources.
There’s more to the story
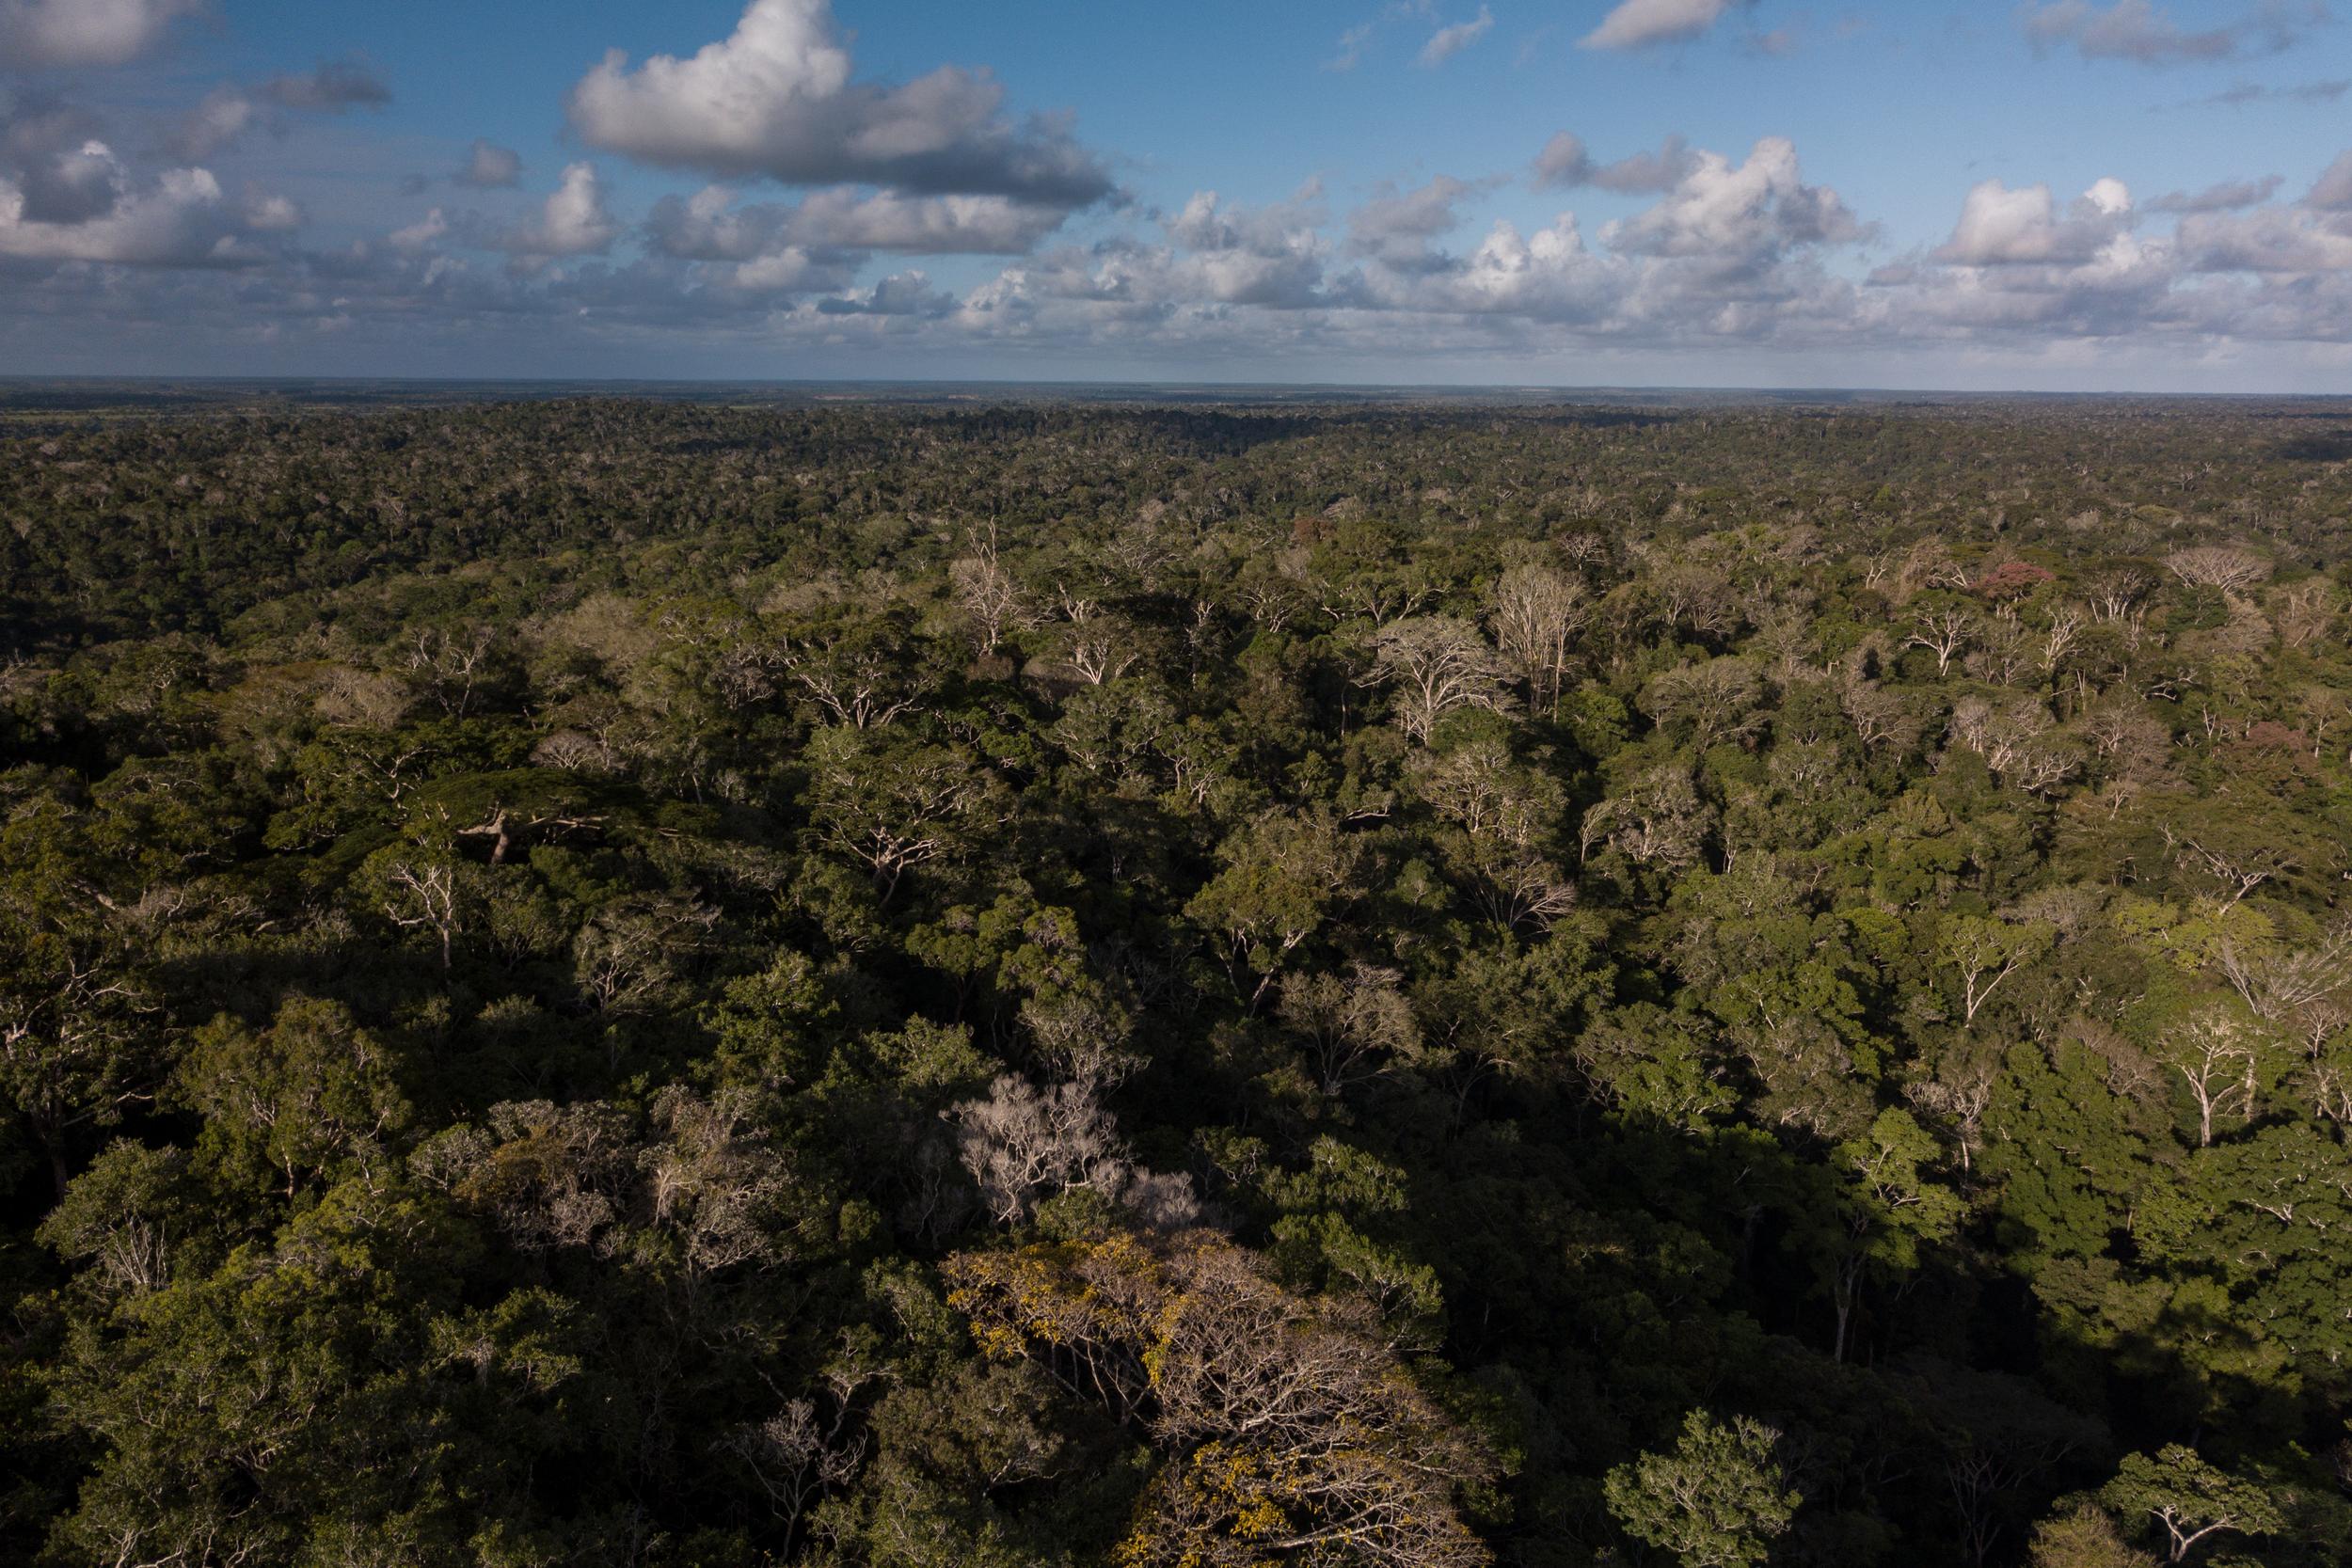
Fires in Amazonia occur year-round but peak in late austral winter
“Fire season” in Amazonia begins in July when farmers in the region typically clear their land with fire to grow crops. Fire is also the main tool for clearing tropical forests. During the dry season, agricultural fires can burn out of control, resulting in deforestation and forest degradation.
Some years are worse than others
Cyclical dry periods are tied to El Niño events, however, a climate-change-induced drying trend is causing more frequent and severe droughts and fires. That’s why our Amazon Restoration Alliance is restoring Brazil’s lands to increase nature’s resilience to climate change. One strategy to reduce the use of fire by farmers is establishing agroforestry systems.
In Brazil, deforestation outside protected and indigenous lands in the Legal Amazon1 has increased in recent years
In public lands, most of the deforestation is happening in rural settlements and public properties. Some of the planet’s most effective stewards of nature, indigenous peoples frequently lack consistent and timely access to the data, technologies and resources necessary to monitor new threats to nature and their livelihoods.
Created with Esri and Apex Charts.
A tipping point
Protected areas and indigenous lands can help us save this vital ecosystem. Up to 15% of the Amazon has already been lost, and researchers suggest that if this reaches 25% to 30%, the entire biome will be permanently altered, with global ramifications for our climate.
Related Resources
Footnotes:
- Brazil's Legal Amazon (or Amazônia Legal) is the largest socio-geographic division in Brazil, containing all nine states in the Amazon basin. It is an official designation covering 59% of Brazil but only 12.34% of the Brazilian population lives there. Although called Amazônia Legal, the region overlaps three different biomes: all of Brazil's Amazon biome, 37% of the Cerrado biome and 40% of the Pantanal biome.